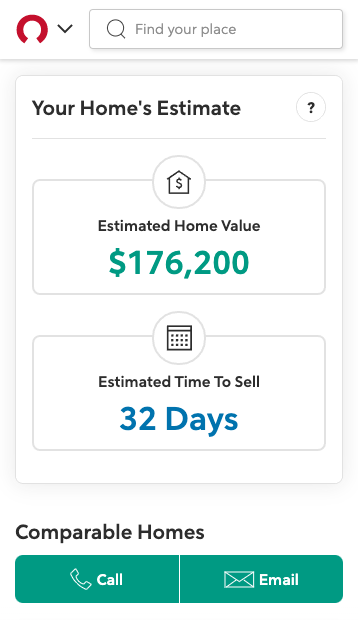
Property Report
Company/ Rocket Homes
Role/ Research Lead & Experience Designer
Responsibilities
Research/ plan development, execution, analysis, and reporting.
Design/ analytics evaluation, wireframes, and defining technology requirements.
Team/ 1 Product Manager, 1 User Experience Designer
Opportunity/ From competitor research and user feedback we identified a need for off-market home listings on Rocket Homes.
Goal/ Create an experience that provides information on home equity and market conditions to drive engagement with home buying and refinancing products.
Impact/ 33% increase in conversion with mortgage and refinance products.
Data-centric design approach
Design approach/ We began with a data-centric approach, using market and property data to create wireframes for feedback. After testing with three users, we identified a major flaw: data complexity and duplication were hurting usability.
Outcome/ To address user frustration with data overload, we shifted to a goal-based approach, mapping each data point to a user need. This revealed redundancies, allowing us to cut content by 50% and validate the changes through user testing.
Design & validation
Goal/ Gather feedback on concept designs for Property Report.
Research approach/ Conducted unmoderated user tests with prototypes with homeowners purchasing a new home in 6 months.
Findings
Users felt the information provided could help with their decision to buy a new home or refinance their current home.
Users were surprised by the amount of public information about their home.
Users wanted more information such as crime and school ratings.
Next steps/ The team refined the designs based on findings and handed them off to development for launch.
Mixed method validation
Goal/ Validate data quality and usability of final product.
Research approach
Survey/ Internal employee survey focusing on data accuracy of the tool.
Unmoderated User Testing/ User testing with homeowners looking to sell in the next six months to test usability of the tool.
Findings
Data quality was low with many of the live test participants unable to complete their tasks due to data being unavailable.
Some survey participants mentioned similar issues, but occurrences were small.
Many participants questioned the data quality and wanted to understand how the information was populated.
Users wanted a way to ‘claim’ their home and edit their home information to update data.
Outcomes/ The team investigated the data issues for several months, but at some point priorities shifted, and the project was left live without updates.


One year later …
During prioritization, Property Report was flagged for decommissioning due to low engagement. I proactively reviewed past research, analytics, and surveys to uncover missed opportunities.
Analytics deep dive
Hypothesis/ Users who have all available data will have higher engagement.
Approach/ I investigated analytics to answer two critical questions:
How many users did, or did not, see all available data?
Comparing the two groups, what was their engagement with the experience?
Findings
Only 15–20% of users saw the full experience, yet they were five times more likely to engage than those who didn’t. After one year, this represented a missed opportunity to reach over a million users.
Identifying the problem
I met with legal, product, and technology to discuss why data would not be loading. We found that during design and development we missed critical data logic that needed to be taken into consideration:
Legal restrictions varied state to state, and some states did not allow our data to be publicly viewed.
Some homes appeared without attributes (beds, baths, sq feet), a flaw in our data provider, which caused data not to load.
Fixing the problem
Identifying that it was both legal and data challenges we approached it in two ways:
Our team began working with our data vendor to ensure higher quality information. Including evaluating out new vendors to increase data quality.
I created wireframes of every page option with technology requirements reflecting our legal and data limitations. This created logic for the experience to change based on available information.
Impact
While it was a long road we had two great outcomes:
The evaluation of the data provider led to the acquisition of a new vendor with higher quality data for across the company.
We went up to an 80 - 90% load rate allowing almost all users to see the available data leading to a consistent 33% increase in engagement with the experience.
The increase in engagement led to retaining the product on Rockets website.


